
Hungary's MNB house price index, Q3 2026: 6.6% annual growth nationally, a quarterly fall in provincial towns – what the data shows and what it does not
North Great Plain −3.8%, South Great Plain −2.5%, Budapest +1.9% in one quarter. What nominal and real indices mean, why one quarter is not a turning point, and what the press calculates for the 5% Wekerle Plusz rate – with sources, without forecasts.

Hungary's central bank, the Magyar Nemzeti Bank (MNB), has published its house price index for the third quarter of 2026. According to the data, prices kept rising nationally, but much more slowly than a quarter earlier, and they fell over the quarter in provincial towns. The Hungarian portals Pénzcentrum and Economx analysed the figures on 26 October. This article summarises the data, explains the concepts and shows what cannot be read from it.
| Fact sheet | |
|---|---|
| Period | Q3 2026 |
| National, quarterly | +0.5% (previous quarter: −0.8%) |
| National, annual nominal | +6.6% (previous quarter: +12.4%) |
| National, annual real | +5.2% |
| Budapest | quarterly +1.9%, annual +5.3% |
| Provincial towns | quarterly −1.4%, annual +8.1% |
| Villages | quarterly +2.6%, annual +4.1% |
Source: MNB house price index 2026Q3 (in Hungarian).

What the data shows
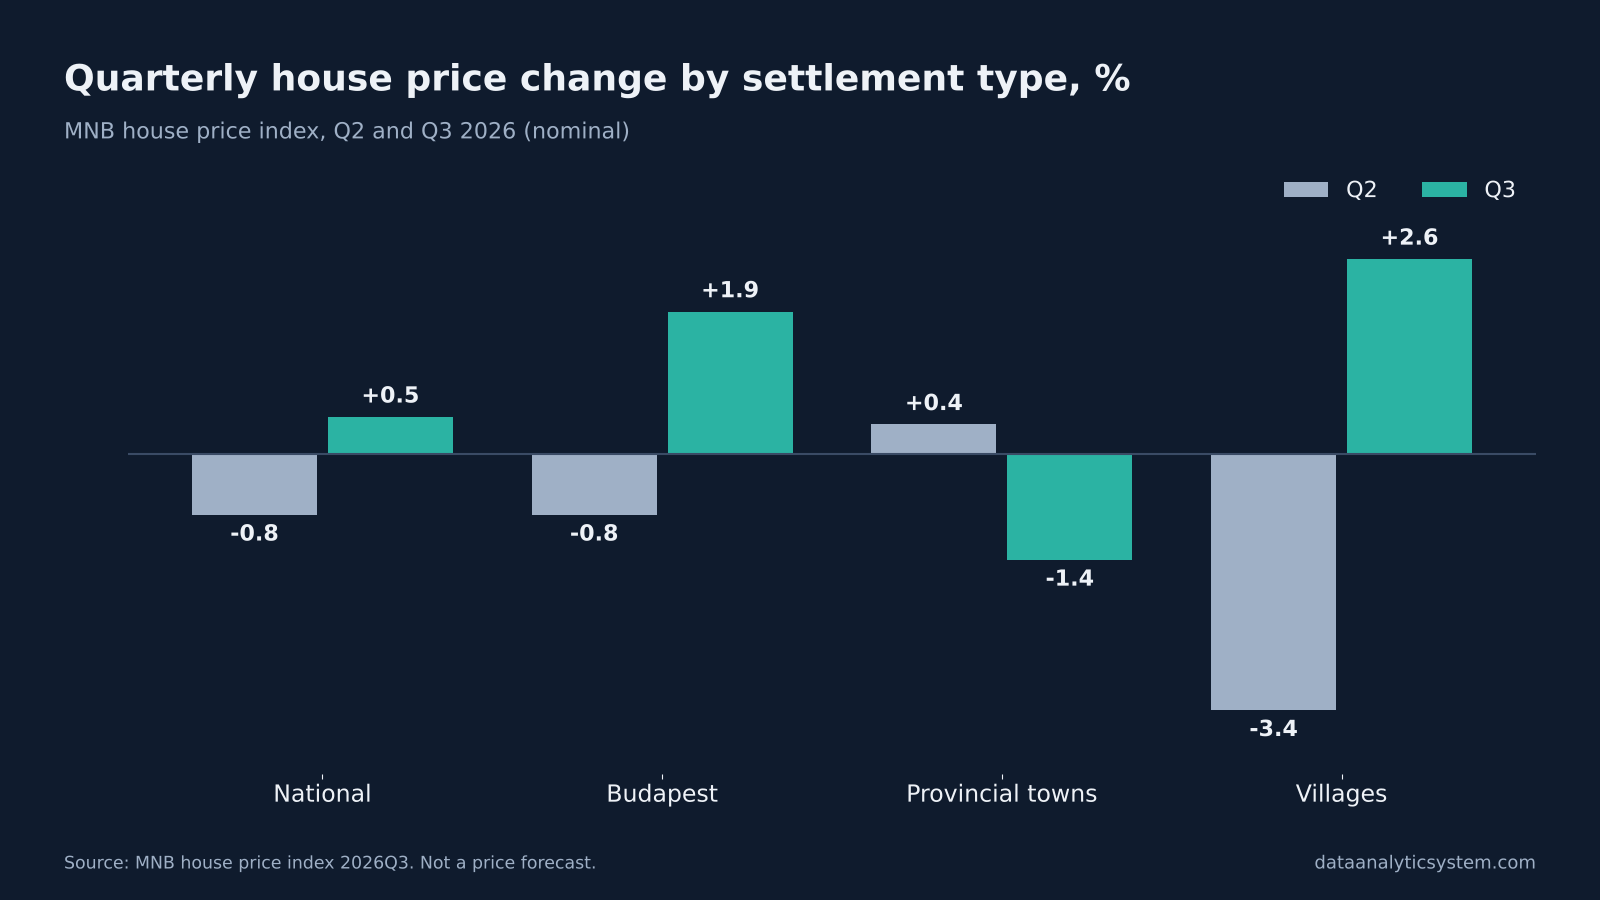
According to the MNB, national house prices rose 0.5% in the third quarter, after a 0.8% fall in the second. Annual growth is 6.6%, little more than half of the previous quarter's 12.4%.
The settlement types moved differently:
| Area | Quarterly | Annual | Previous quarter (quarterly / annual) |
|---|---|---|---|
| Budapest | +1.9% | +5.3% | −0.8% / +7.5% |
| Provincial towns | −1.4% | +8.1% | +0.4% / +16.7% |
| Villages | +2.6% | +4.1% | −3.4% / +7.6% |
Within provincial towns, according to Pénzcentrum, the largest quarterly fall was in the North Great Plain (−3.8%), followed by the South Great Plain (−2.5%), Western Transdanubia (−2.2%) and the towns of Pest county (−1.9%). Northern Hungary saw a 3.5% rise after an 8.5% fall in the previous quarter.
Nominal and real: the difference
The nominal index shows the change in prices measured in forints. The real index removes general price inflation, so it measures how much homes became more expensive relative to other goods and services. According to the MNB, annual real growth is 5.2%. Simple division of the two figures (1.066 / 1.052) gives an implied price-level rise of about 1.3% a year – this article's own calculation, not an MNB figure.
Why one quarter is not a turning point
Pénzcentrum itself is cautious: it says it would be too early to read a lasting, nationwide price fall from the data. There are three reasons:
- One quarter is noisy. In Q2 Budapest and the villages fell and in Q3 they rose; for provincial towns it was the other way round.
- The annual figure is still positive. Homes became more expensive over the year in all three settlement types.
- Purchases brought forward. According to the article, a temporary pick-up can bring purchases forward, which may be followed by weaker demand later. More on this: buyers bringing purchases forward before Otthon Start ends.
The loan side: what the press calculates
According to Economx and Pénzcentrum, under Wekerle Plusz, the successor to Otthon Start, a fixed rate of 5% may apply to second-hand homes instead of the current 3%, while 3% may remain for new homes. The detailed rules are not yet known. Pénzcentrum's example for a HUF 30 million, 25-year loan:
| Rate | Monthly instalment (approx.) |
|---|---|
| 3% fixed | HUF 142,000 |
| 5% fixed | HUF 175,000 |
This article checked both with the annuity formula: they match after rounding. The difference is about HUF 33,000 a month. It is an illustration, not an offer or a personal calculation.
5 things many people don't know
- The MNB and the statistics office publish two separate indices. Both measure house prices, with different methods; see KSH house price index, Q2.
- Asking prices are not transaction prices. Listing sites measure asking prices; the MNB index is built from actual sales.
- Annual and quarterly figures can point in opposite directions. Provincial towns fell over the quarter but are still up 8.1% over the year.
- Pest county towns rose most since Otthon Start. According to Bankmonitor's calculation, they are up 21.7% since the scheme was announced in Q2 2025, against +12.9% nationally.
- The regional figures refer to towns. Pénzcentrum's regional breakdown splits the provincial-town group, not the whole region.
Summary
- Nationally +0.5% over the quarter, +6.6% over the year (previously 12.4%).
- Budapest +1.9%, villages +2.6%, provincial towns −1.4% over the quarter.
- Annual real growth is 5.2%.
- One quarter does not make a lasting trend; changes in loan terms are a separate factor.
Related reading: MNB house price index, Q2 · Wekerle Plusz: the Otthon Start successor · Blog archive.
Educational content. Not financial, lending or property-buying advice, and not a price forecast. Data Analytic Investments is not affiliated with the MNB, Bankmonitor or the portals cited; names are used for identification only. Images labelled "AI illustration" are not photographs.
Continue on DAI
Explore Topics
Written by
Data Analytic Investments
Content creator and writer sharing insights and stories.