
Hungary's inflation was 2.0% in October – fuel up 11.3%, food cheaper. What the data shows and what it does not
Fuel +11.3%, services +5.2%, food −1.1%, piped gas −11.2% over a year. Why the figure rose from September, what core inflation measures, and what one month of data cannot tell you.
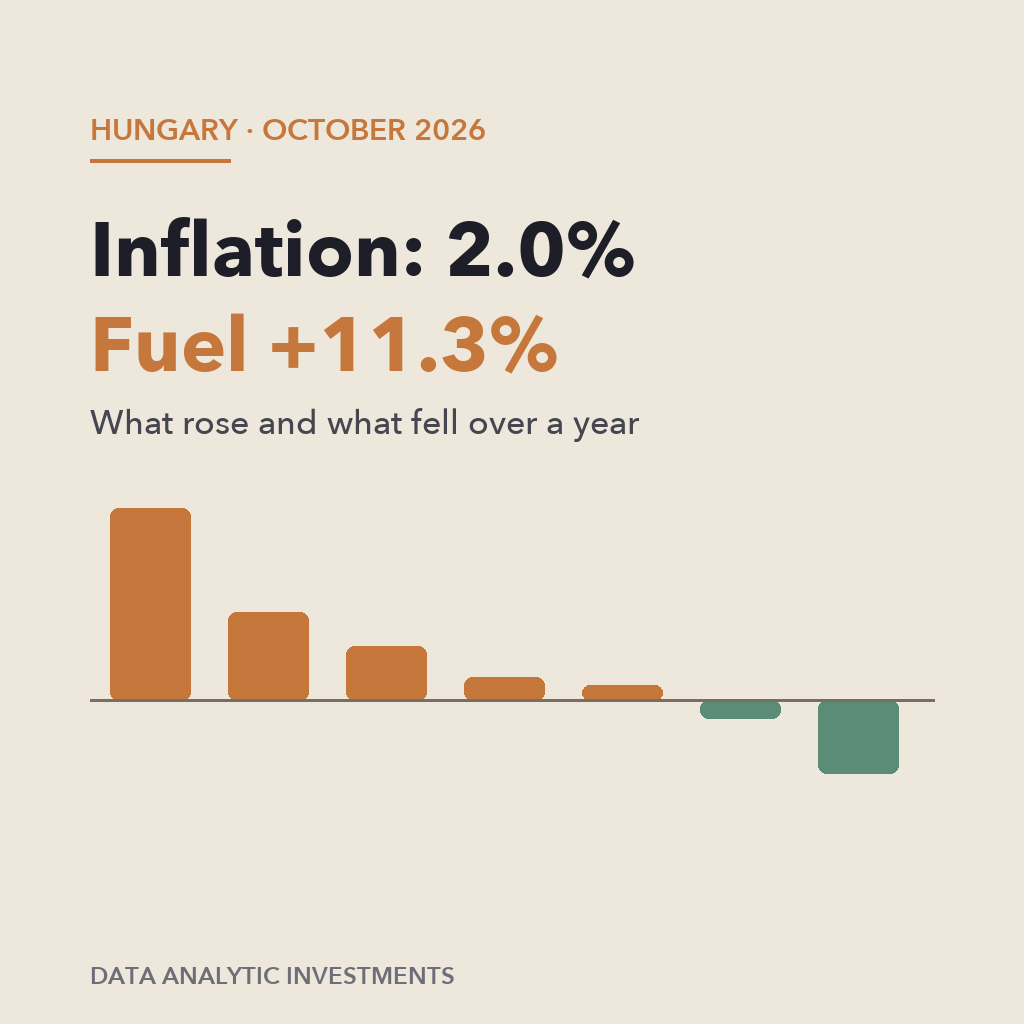
The Hungarian Central Statistical Office (KSH) published its October consumer price index on Tuesday, 10 November 2026. Consumer prices were on average 2.0% higher than a year earlier, up from 1.6% in September. Compared with September, prices rose 0.4%. According to ProfitLine, this is the highest annual rate since April; analysts had expected 1.9% on average. The detailed breakdown by product group was reported by Economx.
This article summarises the numbers, explains the concepts, and shows what a single month of data cannot tell you.
| Data sheet | |
|---|---|
| Period | October 2026 |
| Annual inflation | 2.0% (September: 1.6%) |
| Monthly change | +0.4% |
| Core inflation, annual | 2.1% (September: 1.9%) |
| Pensioner basket, annual | 1.4% (September: 1.1%) |
| Published | KSH, 10 November 2026 |
What got more expensive, what got cheaper – over a year
| Product group | Annual change |
|---|---|
| Motor fuels | +11.3% |
| Services | +5.2% |
| Alcohol and tobacco | +3.2% (tobacco: +4.2%) |
| Durable goods | +1.4% |
| Medicines | +0.9% |
| Food | −1.1% (excluding catering: −4.1%) |
| Household energy | −4.3% (piped gas: −11.2%, electricity: +1.2%) |
Source: KSH data as reported by Economx and ProfitLine.
Over one month: fuel moved the figure
Compared with September, fuel rose 3.0% and clothing 2.1%. Food and services each rose 0.2%, while household energy fell 0.3%.
A few items from the Economx list, over a year:
- More expensive: potatoes +14.0%, taxis +11.6%, postal services +9.6%, personal care +9.0%, health services +7.1%, phone and internet +6.2%.
- Cheaper: butter −14.0%, fresh fruit −12.9%, eggs −6.9%, sugar −5.9%, poultry −5.1%, televisions −3.9%.
The concepts – briefly
Consumer price index (inflation). KSH tracks the price of a fixed "basket": the goods and services an average household spends money on. The annual figure shows how much more that basket costs than a year earlier.
Core inflation. The part of the index that leaves out the most volatile items, such as fuel and regulated prices. It shows how broad-based price increases are. In October it was 2.1%, slightly above the headline figure.
Pensioner basket. The same measurement, weighted by how pensioner households spend. Because they spend more on food and energy, and those got cheaper, the pensioner index (1.4%) is below the headline.
Monthly vs annual. The monthly figure shows the immediate move; the annual one covers the full past twelve months. The annual figure can rise even when the monthly increase is small, because a month from a year earlier drops out of the comparison. This is called a base effect.
What the data does NOT show
- It is not your personal inflation. If you drive a lot, the 11.3% fuel increase weighs more; if you heat with gas, the −11.2% matters. The average describes a basket, not a household.
- One month is not a trend. Fuel prices move quickly in both directions. Whether the acceleration lasts will only show in several months of data.
- It is not a rate decision. Central bank decisions depend on many factors, not a single monthly figure.
- It is not a forecast. The press reports analysts' year-end estimates; this article makes none.
Summary
- Annual inflation in October was 2.0%, up from 1.6% in September.
- The main driver was fuel: +11.3% over a year, +3.0% over a month.
- Services rose 5.2%; food fell 1.1% and piped gas 11.2%.
- Core inflation 2.1%, pensioner basket 1.4%.
To follow figures like these in one place, with sources and timestamps: Market Observation.
Related reading: US inflation: what's in the basket · Blog archive.
Educational content. Not financial or investment advice, and not a forecast. Data Analytic Investments is not affiliated with KSH or the portals cited; names are used for identification only.
Continue on DAI
Explore Topics
Written by
Data Analytic Investments
Content creator and writer sharing insights and stories.