
Euro area GDP in the third quarter: +0.4%, but less without Ireland – what the flash estimate measures and what it does not
One number for 21 countries, with very different national figures behind it. What a flash estimate is, why Ireland lifts the average, and when the revision comes – with sources, without forecasts.

On 30 October Eurostat published its flash estimate of third-quarter GDP. The euro area economy grew by 0.4% and the European Union's by 0.5% compared with the previous quarter. This article explains what the number measures, what lies behind it country by country, and how final it is. It offers no forecast of its own.
| Fact sheet | |
|---|---|
| Euro area, quarter on quarter | +0.4% (Q2: +0.6%) |
| Euro area, year on year | +1.3% (Q2: +1.2%) |
| EU, quarter on quarter | +0.5% (Q2: +0.7%) |
| EU, year on year | +1.5% (Q2: +1.4%) |
| Ireland, quarter on quarter | +5.5% |
| Hungary, quarter / year | +0.1% / +1.5% |
| Next estimate | 13 November 2026 |
Source: Eurostat, 30 Oct.

What Eurostat published
The release gives seasonally adjusted, chain-linked volume figures. This means the effect of price changes is removed and seasonal swings are smoothed out. The quarterly number compares with the previous quarter; the annual number compares with the same quarter a year earlier.
According to a Finimize summary, the market expectation was 0.2%, so the actual 0.4% came in higher.
Country by country
The release table covers 15 countries:
| Country | Quarter on quarter | Year on year |
|---|---|---|
| Ireland | +5.5% | +3.6% |
| Spain | +0.6% | +2.7% |
| Netherlands | +0.6% | +2.1% |
| Estonia | +0.6% | +2.2% |
| Czechia | +0.5% | +1.6% |
| Finland | +0.5% | +1.8% |
| Sweden | +0.4% | +2.8% |
| Belgium | +0.3% | +0.7% |
| Germany | +0.2% | +1.2% |
| Austria | +0.2% | +0.6% |
| Portugal | +0.2% | +2.4% |
| Hungary | +0.1% | +1.5% |
| Italy | 0.0% | +0.8% |
| France | −0.1% | −0.1% |
| Lithuania | −1.0% | +2.3% |
Source: Eurostat.
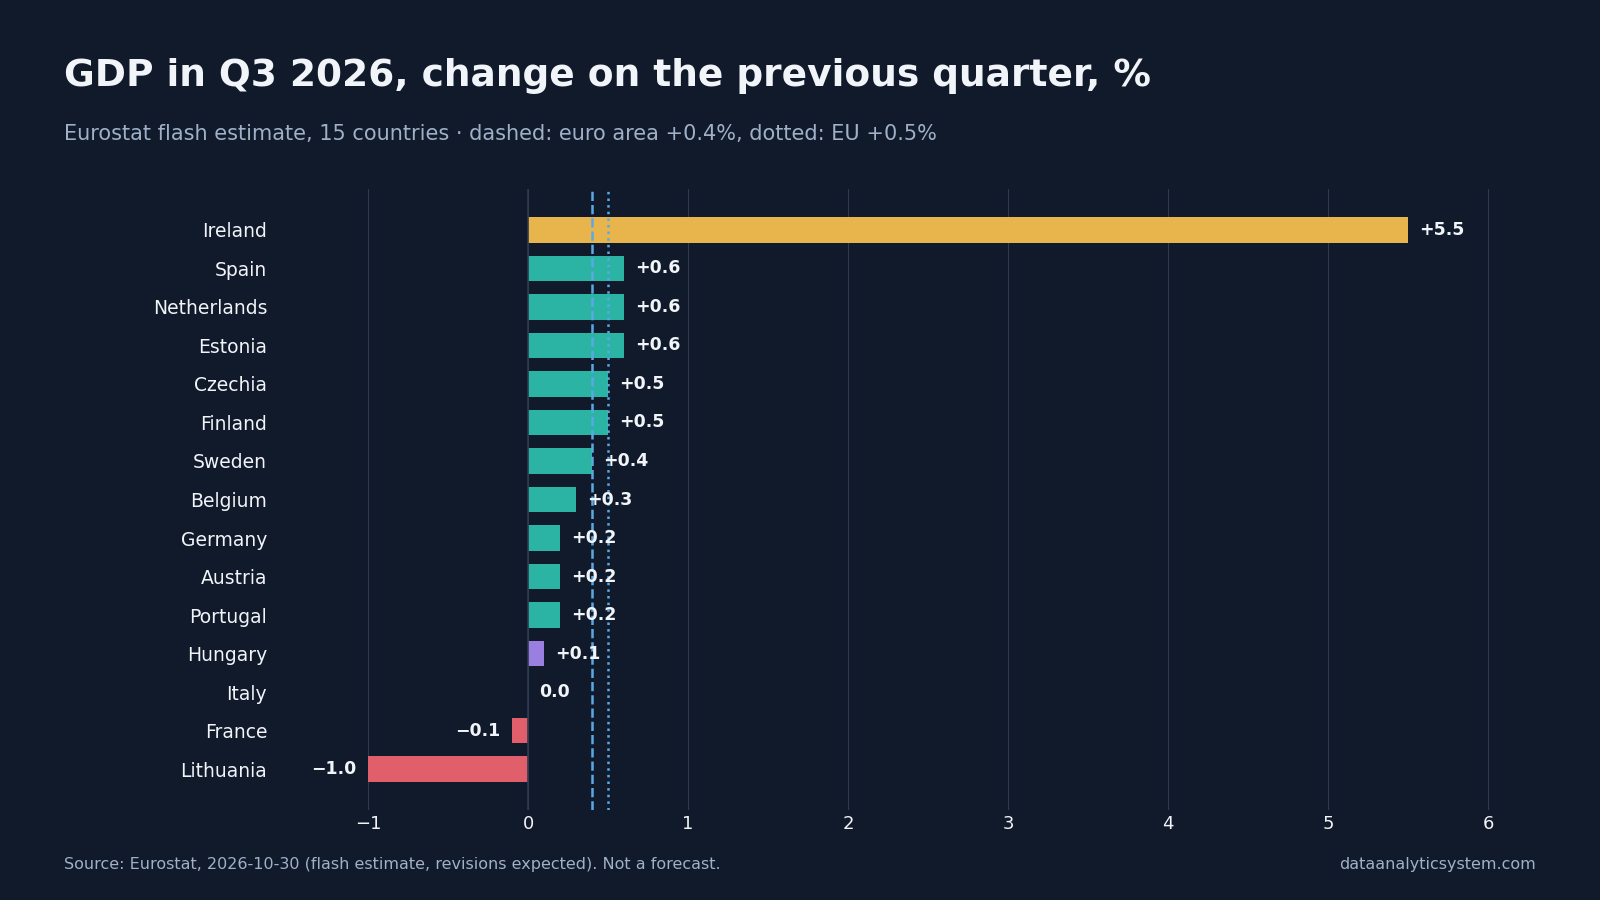
The release says annual growth was positive in 14 countries and negative in one (France). Czechia, Sweden and Hungary are not in the euro area; they count towards the EU figure.
Why Ireland matters
Ireland's economy is small within the euro area, but a quarterly 5.5% is so far out of line that it noticeably lifts the average. Finimize cites an ING estimate: without Ireland, euro area growth would have been around 0.2%, and growth outside Ireland has slowed for three quarters in a row.
The Irish figure is also experimental. According to Eurostat, it comes from the Irish statistics office's (CSO) experimental "Frontier" series, based mainly on output data, and will be revised once expenditure-side data arrive. Many large multinational companies book intellectual property and profits in Ireland, so Irish GDP can swing sharply from quarter to quarter.
How final is the number
The flash estimate appears about 30 days after the quarter ends. According to Eurostat:
- it is based on data from 19 member states, covering 96% of euro area GDP and 94% of EU GDP;
- the data sources are incomplete and revisions are expected;
- the 45-day estimate comes on 13 November, with further revisions on 7 December and 19 January 2027.
This flash estimate does not revise earlier quarters.
The Hungarian figure
In Eurostat's table, Hungary's third-quarter growth is 0.1% on the previous quarter and 1.5% on a year earlier. Detailed national figures come from Hungary's statistics office (KSH); differences between the quarterly flash and the detailed release also occur in Hungary.
What the GDP flash does not measure
The flash estimate gives only the change in total output. It does not say whether growth came from consumption, investment or exports, nor does it cover employment: this release contains no employment figures. Those details appear in later estimates. On its own, the quarterly GDP figure also says nothing about income per person or the position of households.
5 things many people don't know
- Quarterly and annual figures tell different stories. Lithuania's quarterly figure is −1.0%, yet its annual figure is +2.3%, because earlier quarters were strong.
- The flash is not complete. 96% coverage means a few countries' data are still missing.
- One country can move the average. ING says that without Ireland the euro area figure would have been around 0.2%.
- The second quarter was stronger. The euro area grew 0.6% in Q2, so the quarterly pace has slowed.
- Calendar effects matter. For the Netherlands, Finland and Sweden, the annual rate is computed from calendar-adjusted data.
How it connects to the ECB decision
The day before, on 29 October, the ECB kept its deposit rate at 2.50%, and its statement said rising energy prices are a downside risk to growth. The GDP figure describes July to September, that is, the past. How the two interact will show in the coming quarters' data.
Summary
- Euro area GDP grew 0.4% and EU GDP 0.5% in the third quarter.
- Ireland +5.5%; according to ING, without it the euro area would have been around 0.2%.
- France −0.1%, Italy 0.0%, Germany +0.2%.
- Hungary +0.1% quarter on quarter, +1.5% year on year.
- The number is a flash estimate; the next version comes on 13 November.
Related reading: ECB decision, 29 October · Moody's: France Aa3 · Blog archive.
Data Analytic Investments is not affiliated with Eurostat or the portals cited; names are used for identification only.
Educational content. Not investment advice.
Continue on DAI
Explore Topics
Written by
Data Analytic Investments
Content creator and writer sharing insights and stories.