What moves the gold price in autumn 2026: central banks, ETFs, rates and the dollar
A record in January, a sharp fall by June, then a sideways autumn. Which forces move gold in 2026, and how the reference price is set in London, explained with published data and without a forecast.
Gold set an all-time high in late January 2026, lost about a quarter by late June, and in October trades a little above $4,100 an ounce. This explainer looks at the forces behind those moves, using published data only. It makes no forecast of its own.
Where the price stands
On 21 October 2026 at 8:50 a.m. New York time, gold cost about $4,127 per troy ounce. A troy ounce is 31.1 grams. That was about 5% below a month earlier ($4,360) and 2% below a year earlier ($4,208), per the same source.
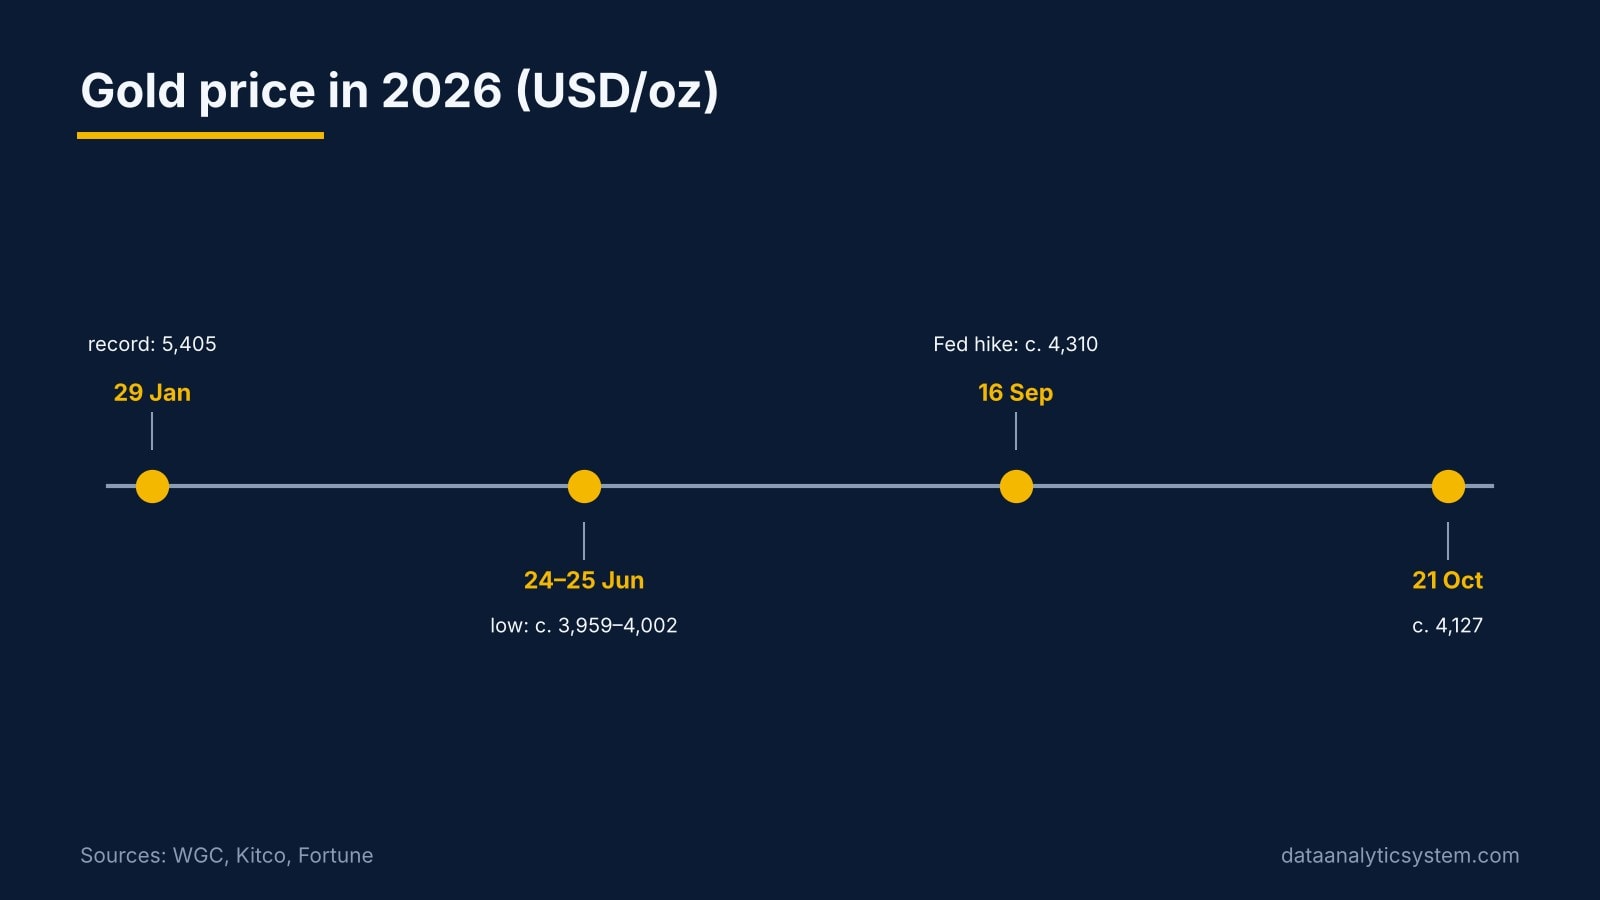
The record came on 29 January. The London reference price closed at $5,405.00, and the intraday spot high was $5,595.47, according to the World Gold Council (WGC). The low so far came in late June: $4,001.80 on the London reference price on 25 June and $3,959.33 intraday on 24 June, per the same report.
| Date (2026) | What happened | Gold, USD/oz | Source |
|---|---|---|---|
| 29 January | All-time high (London reference price) | 5,405.00 | WGC |
| 24–25 June | Low of the year so far | 3,959.33 spot / 4,001.80 reference | WGC |
| 16 September | Fed raises rates by 0.25 point | about 4,310 spot | Kitco |
| 21 October | Pre-Fed-meeting week | about 4,127 | Fortune |
In forints. The Hungarian central bank (MNB) mid-rate on 21 October was 325.53 forints per dollar. Multiplied out, one ounce cost about 1.34 million forints, or about 43,200 forints per gram. On 29 January the MNB rate was 319.15, so the record price equalled about 1.73 million forints per ounce, or roughly 55,500 per gram. Dealer prices differ from this simple arithmetic. As the dollar gained on the forint, the fall since January was about 22% in forints versus 24% in dollars.
How the "spot price" is set
The price on a screen is the "spot" price: the live price at which banks trade gold for immediate delivery. Beside it there is a reference price, the LBMA Gold Price, which many contracts use.
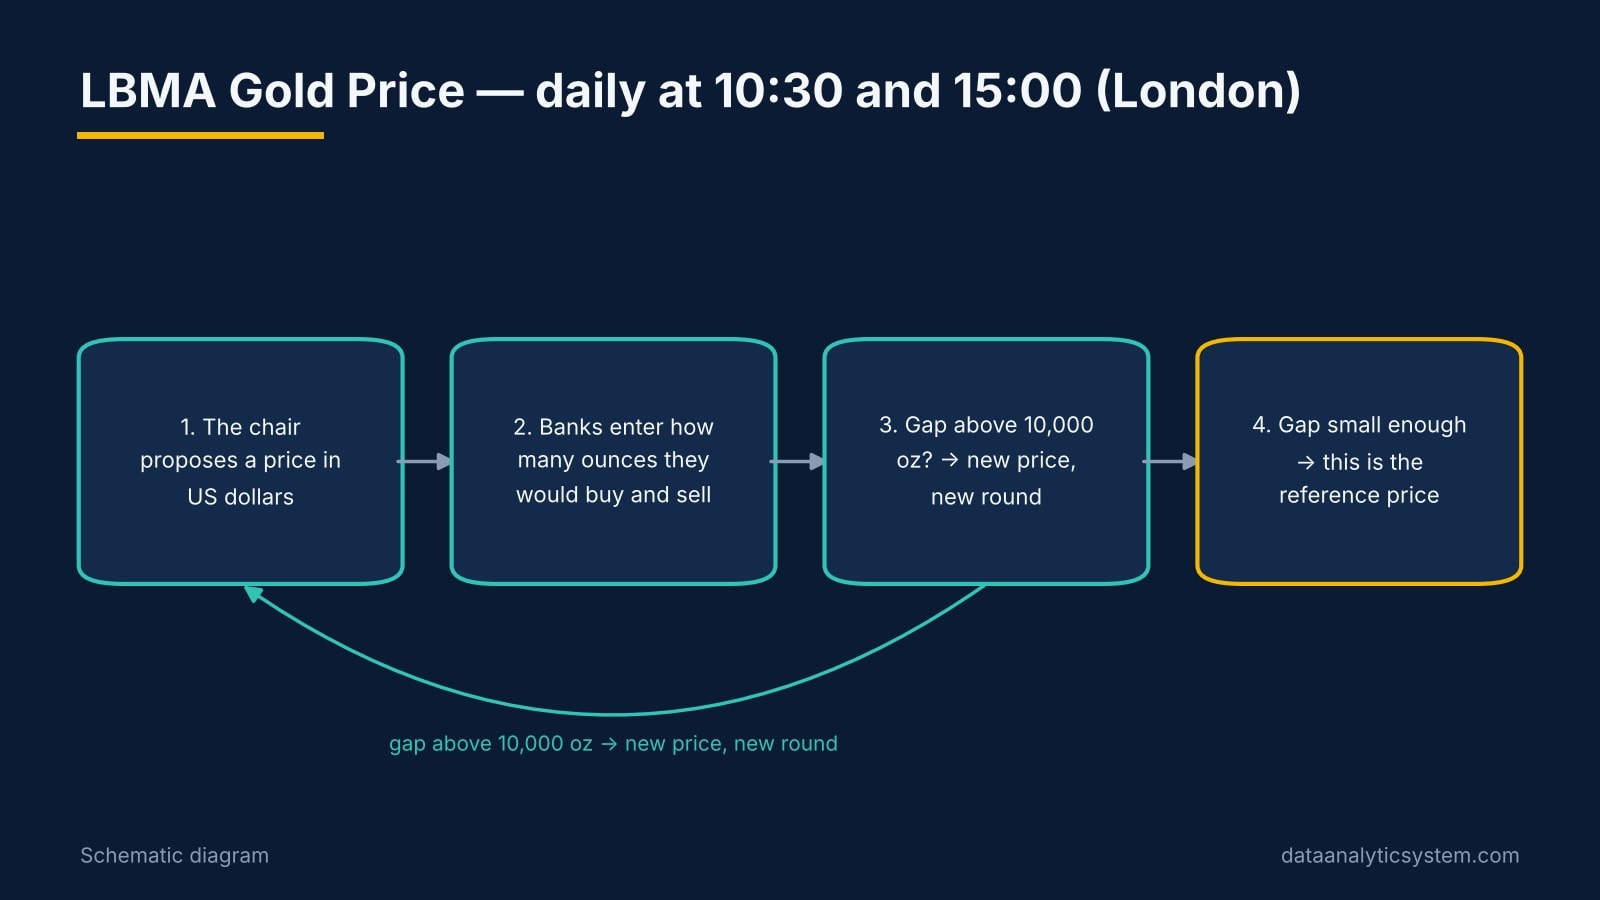
The reference price is set twice a day, at 10:30 and 15:00 London time, in an electronic auction run by ICE Benchmark Administration. It works like this. A chairperson proposes a dollar price, and banks enter how many ounces they would buy and sell at it. If buying and selling differ by more than 10,000 ounces, the price is moved and a new round starts. When the gap is small enough, that number becomes the price. Any small leftover gap is shared equally among the direct participants.
Central banks: the steady buyer
Central banks have been large buyers since 2022. According to the WGC's Q2 2026 report, they added a net 289 tonnes in the second quarter, 62% more than a year earlier. Kitco's summary of the same report names Poland (51 tonnes) and China (33 tonnes) as the largest reported buyers. In a WGC survey, 45% planned to raise their gold reserves within 12 months.
In August, central banks bought a net 39 tonnes. China added 20 tonnes, Uzbekistan and Poland 8 each, Kazakhstan 7. Russia (6 tonnes) and Jordan (3 tonnes) sold.
The MNB. Hungary held only about 3 tonnes for a long time. The MNB bought about 28 tonnes in October 2018 and about 63 tonnes in April 2021, reaching 94.5 tonnes. A further 15.5 tonnes in 2024 brought it to 110 tonnes. At the end of August 2026 that stock was worth about €13.6 billion. In September the MNB said its Monetary Council had reviewed the gold strategy and that no increase is currently on the agenda.
ETFs: gold bought through the stock exchange
An ETF (exchange-traded fund) is a fund traded on a stock exchange; a gold ETF holds physical gold in a vault. In the second quarter they sold: the WGC counted 45 tonnes of outflows. The third quarter turned around. Gold ETFs took in a record $31 billion in Q3, including $10 billion in September, and total holdings reached a record 4,256 tonnes.
Interest rates and the dollar
Gold pays no interest, so high rates make holding it costlier. Economists watch the "real" interest rate: the interest rate minus expected inflation. One common measure is the yield on 10-year US inflation-protected bonds (TIPS). It stood at 2.77% on 20 October, up from 2.42% on 4 September.
Both big central banks raised rates in 2026. The US Federal Reserve raised its target range to 3.75–4.00% on 16 September, by a 12–0 vote. Per Kitco, 16 of 18 policymakers expected one more hike in 2026. The next Fed meeting is on 27–28 October. The European Central Bank raised its deposit rate in June and again on 10 September, to 2.50%; its next decision is due on 29 October.
Gold is priced in dollars. A stronger dollar makes gold more expensive for buyers paying in other currencies. The dollar index was near 101.7 on 21 October. The WGC's model attributed first-half price swings 24% to momentum, 17% to risk, 14% to the dollar and only 3% to rates.
War: why it did not simply push gold up
War usually adds demand for gold as a safe asset, but in 2026 the picture was mixed. The war involving Iran drove oil up: Brent crude was above $110 a barrel in October. Expensive oil raised inflation fears, then rate-hike expectations, a stronger dollar and higher real yields. According to Kitco's report on WGC data, that chain was behind the second-quarter fall.
Jewellery and industry
In the second quarter, jewellery demand was 278 tonnes, 17% less than a year earlier, the weakest quarter since the pandemic. China fell 28%, India 15%. Technology demand was 80.4 tonnes, up 2%. Electronics rose 4%, driven by chips and circuit boards for AI servers, according to the WGC.

What third parties forecast
Quoted for information only. Goldman Sachs cut its end-2026 fair value for gold to $4,650 from $4,900 and kept $5,400 for end-2027, per a 23 September report. In July, the WGC's baseline scenario for the second half was a range around $4,100, plus or minus 5%.
5 things many people don't know
- Central bank data get revised heavily. Q1 2026 central bank demand was first put at 244 tonnes, then cut to 57 tonnes, with 187 tonnes reclassified.
- Two counts, two numbers. Monthly officially reported purchases came to 170 tonnes for January–August. The quarterly estimate for the second quarter alone was 289 tonnes. The two series are compiled differently.
- More tonnes, fewer dollars. In September, ETF holdings hit a record in tonnes, yet their dollar value fell 7% in the month to $574 billion, because the price dropped.
- Deep falls after records are not rare. Since 1971, gold has fallen more than 20% from a record eight times; the median fall was 29%. At the June low, the 2026 fall from the intraday high was about 29%.
- Part of Hungary's gold is in London. 94.5 tonnes are in Budapest and 15 in London. Per person, Hungary holds 0.37 troy ounces, first in Central and Eastern Europe.
Summary
- Gold peaked at $5,405 (reference price) on 29 January and traded near $4,127 on 21 October, about 43,200 forints per gram.
- Central banks bought a net 289 tonnes in Q2; ETFs took in a record $31 billion in Q3.
- The Fed (3.75–4.00%) and the ECB (2.50%) both raised rates; the real yield rose to 2.77%.
- The war-driven oil shock fed rate-hike expectations, so it did not simply push gold up.
- Next on the calendar: the Fed on 27–28 October, the ECB on 29 October.
Related reading: Research archive.
Educational content. Not investment advice. Data Analytic Investments is not affiliated with the World Gold Council, LBMA, ICE Benchmark Administration, Goldman Sachs, the Federal Reserve, the European Central Bank or the Magyar Nemzeti Bank; brand names are used for identification only. Illustrations marked "AI illustration" are not photographs.
Continue on DAI
Explore Topics
Written by
Data Analytic Investments
Content creator and writer sharing insights and stories.