The economics of Halloween 2026: $13.5 billion, costumes, candy and pets – what the NRF survey measures
Record total spending, barely higher spending per person, 74% celebrating. Where the money goes, which costumes lead, where people shop and what a ±1.1-point margin of error means – the numbers of one US survey, without a forecast.
On 22 September 2026 the National Retail Federation (NRF), the US retail trade association, published its annual Halloween survey. It says Americans plan to spend $13.5 billion on the holiday this year, more than the 2025 record of $13.1 billion. This article looks at what the numbers show and how the survey was made.
| Fact sheet | 2026 | 2025 |
|---|---|---|
| Total planned spending | $13.5B | $13.1B (record) |
| Per person | $115.14 | $114.45 |
| Share celebrating | 74% | 73% |
| Survey | 1–9 Sept 2026, 7,889 people, ±1.1 points |
Source: NRF, 22 September 2026; summary: CPA Practice Advisor.
More people, barely more money each
Total spending rose about 3% in a year (from $13.1 billion to $13.5 billion). Spending per person rose only about 0.6%, from $114.45 to $115.14. This is our own simple arithmetic from the NRF's figures.
Part of the gap may come from more people taking part, or from population growth. According to the NRF, 74% celebrate, against 73% a year ago and 68% in 2019. A one-point change sits inside the ±1.1-point margin of error, so on its own it does not prove growth. The gap against 2019 is much larger.
Where the money goes
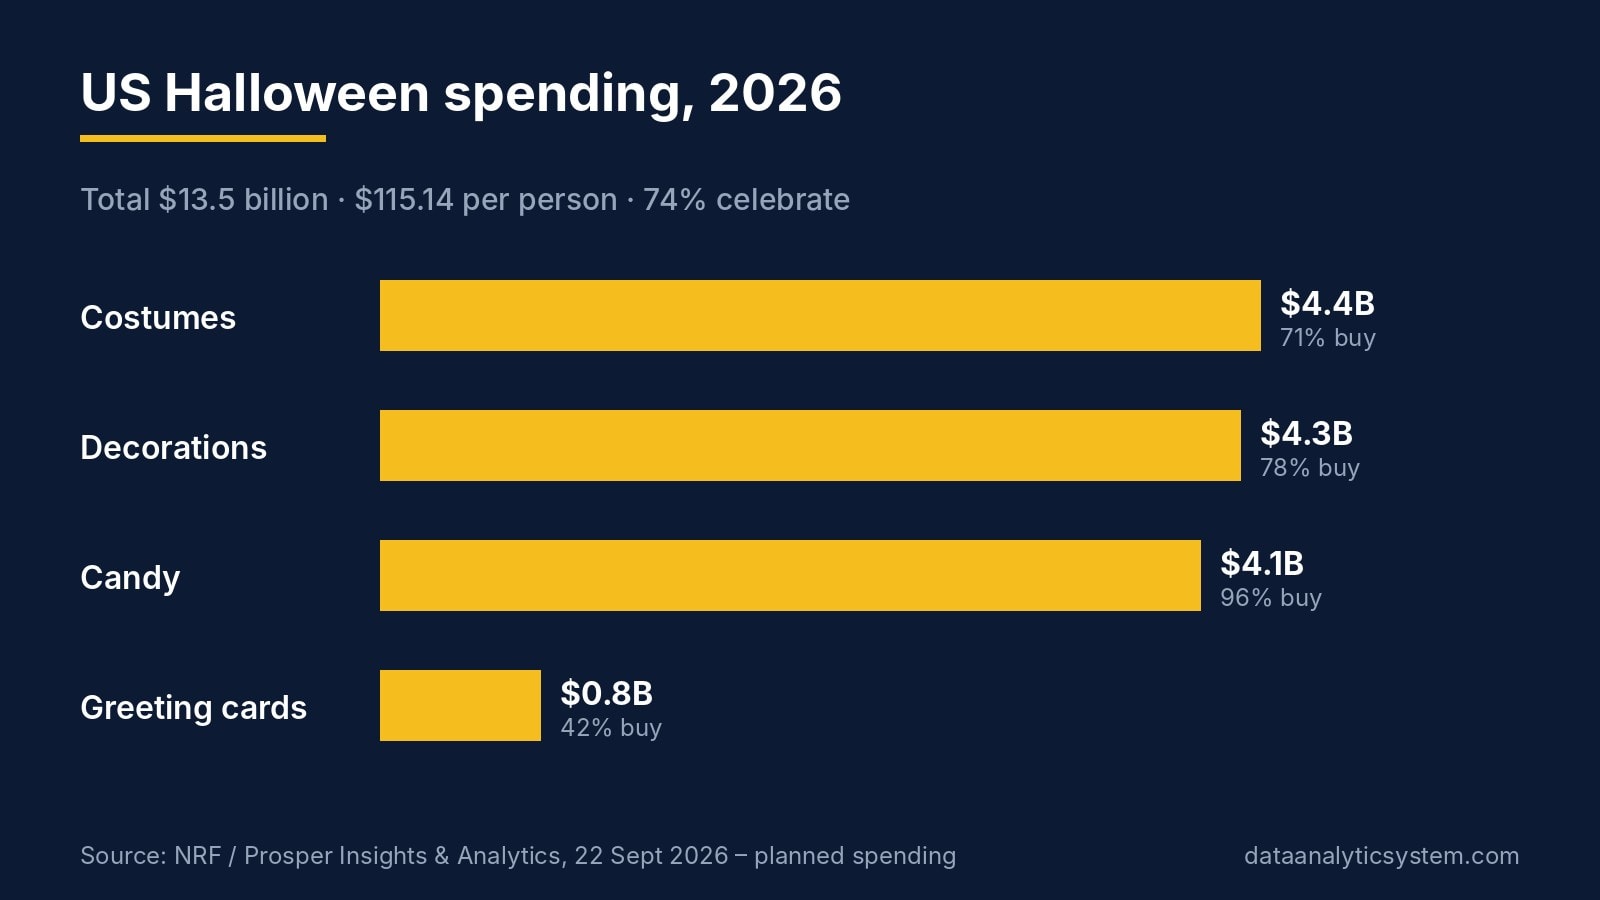
| Category | Planned spending | Share buying |
|---|---|---|
| Costumes | $4.4B | 71% |
| Decorations | $4.3B | 78% |
| Candy | $4.1B | 96% |
| Greeting cards | $0.8B | 42% (2025: 38%) |
Source: NRF.
Almost everyone buys candy, but the most money goes on costumes. Costume spending splits into adults $2 billion, children $1.5 billion and pets $0.92 billion.
The favourite costumes
The NRF projected the answers onto national numbers:
| Children | Adults | Pets |
|---|---|---|
| Spider-Man – 4.6 million | witch – 4.8 million | pumpkin – 11.6% |
| superhero – 2.3 million | vampire – 4.2 million | hot dog – 5.9% |
| princess – 2.2 million | Batman – 2 million | ghost – 2.8% |
| witch – 1.6 million | Spider-Man – 1.5 million | |
| ghost – 1.6 million | ghost – 1.4 million |
Source: NRF.
Where and when people shop
- Discount stores: 39%
- Halloween and costume specialty stores: 32%
- Online: 27%
- Local and small businesses: 13% (7% in 2016)
49% plan to start shopping in September or earlier, about the same as last year. In 2016, 34% shopped before October.
32% look for costume ideas through online search, down from 37% a year ago. According to the survey, 47% use AI tools for Halloween shopping: 34% to brainstorm ideas while planning and 32% to get recommendations while researching products. Phil Rist, executive vice president of strategy at Prosper Insights & Analytics, said AI is becoming an increasingly common part of the shopping journey.
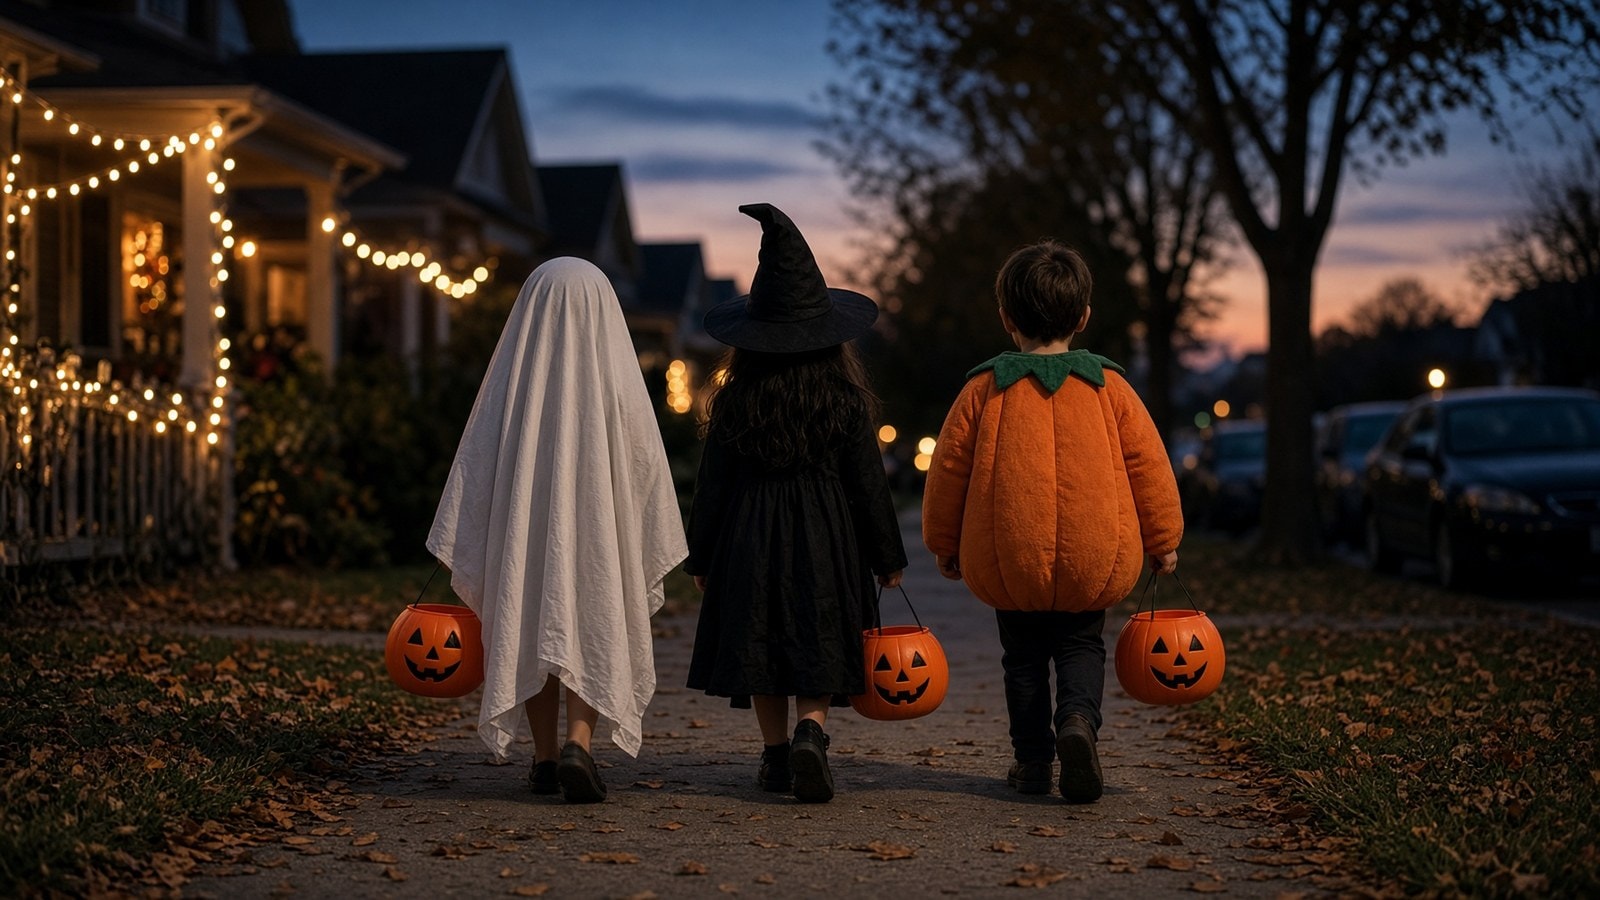
What people do
| Activity | Share |
|---|---|
| Handing out candy | 61% |
| Dressing in costume | 50% |
| Decorating home or yard | 42% |
| Carving pumpkins | 42% |
| Watching scary movies | 42% |
Source: NRF.
How the survey was made
Prosper Insights & Analytics collected the data from 1 to 9 September 2026, asking 7,889 US consumers. The margin of error is ±1.1 percentage points.
What does that mean? If 74% of respondents say they celebrate, the true share for the whole population is very likely between 72.9% and 75.1%. The spending figures are plans: they measure what people intend to spend, not what tills finally record.
5 things many people don't know
- Pet costumes cost almost a billion dollars. The NRF puts them at $0.92 billion, about a fifth of all costume spending.
- The top pet costume is a pumpkin. It leads the NRF list with 11.6%, ahead of the hot dog (5.9%).
- Local small shops nearly doubled their share. 7% shopped there in 2016, 13% in 2026.
- Greeting cards are back. The share buying them rose from 38% to 42% in a year.
- Candy is the most common purchase, not the most expensive one. 96% buy candy, yet they spend less on it ($4.1B) than on costumes ($4.4B) or decorations ($4.3B).
Summary
- The NRF expects $13.5 billion in US Halloween spending in 2026.
- $115.14 per person, barely more than last year; 74% celebrate.
- The biggest item is costumes ($4.4B); the most common purchase is candy (96%).
- The figures are plans, from a 7,889-person survey with a ±1.1-point margin of error.
Related reading: Blog archive.
Educational content. Not investment advice. Data Analytic Investments is not affiliated with the National Retail Federation, Prosper Insights & Analytics or the portals cited; character and brand names of costumes (e.g. Spider-Man, Batman) are used only to quote the survey and belong to their owners. Illustrations marked "AI illustration" are not photographs.
Continue on DAI
Explore Topics
Written by
Data Analytic Investments
Content creator and writer sharing insights and stories.