
The Strait of Hormuz in numbers: a tanker's journey in autumn 2026
A strait 21 miles wide, a fifth of the world's oil use, Brent at $111. Following one tanker, here is what the data shows in the eighth month of the 2026 Middle East war.
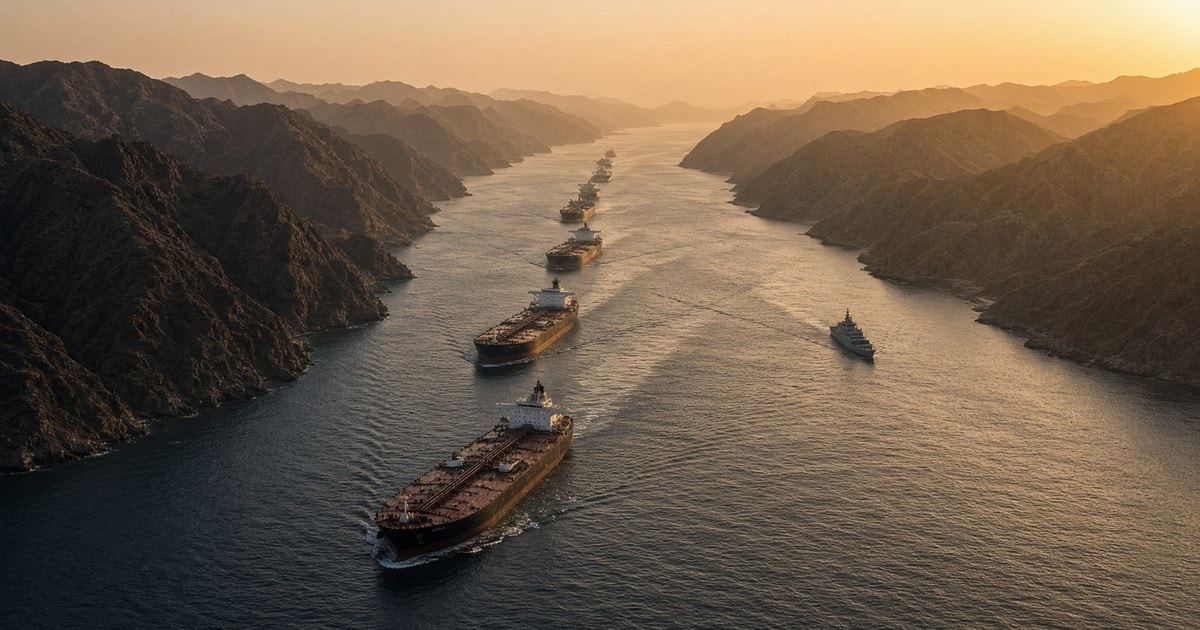
One ship, one strait, one price. Sources at the end of each paragraph.
Picture an oil tanker deep in the Persian Gulf, heading out towards the Gulf of Oman one evening. Ahead lies 21 miles of water: the width of the Strait of Hormuz at its narrowest point. Ships get a 2-mile lane in each direction, with a 2-mile buffer between the two. (USIP Iran Primer, citing EIA)
In 2024 an average of 20 million barrels of oil a day passed through this narrow stretch. That is about a fifth of world petroleum liquids consumption, and around a fifth of global trade in liquefied natural gas (LNG), mostly from Qatar. (EIA, 16 June 2025)
What changed in 2026
The war began on 28 February 2026. In March the US Navy said it would escort tankers. The strait was closed for a period, a ceasefire came in April, and tankers were transiting again by June. (Al-Monitor, 7 October 2026; Wikipedia: 2026–2028 world oil market chronology)
In the autumn the attacks picked up again. Between 28 September and 5 October at least 12 tankers were attacked, the worst week of the war. In the first half of October 23 attacks were counted, and according to the International Maritime Organization (IMO) 24 seafarers have died since the war began. (Al-Monitor/Reuters, 7 October 2026; Ahram Online, 15 October 2026)

The journey in five numbers
1. The price. Brent crude closed at $72.48 a barrel on 27 February, the last trading day before the war. On 21 October it traded between $108 and $111. (Wikipedia chronology; Trading Economics, 21 October 2026)
2. The flow. According to International Energy Agency (IEA) data for September, Gulf producers exported 13.9 million barrels of crude a day, roughly three quarters of the pre-war level. (IEA data via a secondary source, 16 October 2026)
3. The detour. Saudi Arabia can also send oil through its East–West pipeline to the Red Sea port of Yanbu, with a capacity of 5 million barrels a day (temporarily 7 million in 2019). The UAE's pipeline to Fujairah can carry 1.8 million barrels a day. (EIA, 16 June 2025)
4. The escort. In June the US Navy was escorting about 7 million barrels a day of traffic, half the pre-war volume. (E&E News, 12 June 2026)
5. On land. On 10 October a Houthi missile hit King Khalid International Airport in Riyadh, killing 13 people. On the night of 13–14 October Saudi Aramco's headquarters in Dhahran was struck; the Saudi energy ministry reported a "limited fire", no casualties and no damage to oil production. (The National, 12 October 2026; Ahram Online, 15 October 2026)
And at the pump?
In the US consumer price index, gasoline was 34.2% more expensive in September 2026 than a year earlier. The American Automobile Association (AAA) put the average price at $4.36 a gallon in early October, against $3.12 a year before. (BLS, 16 October 2026; AAA, 8 October 2026)
What the data cannot tell you
Export figures differ between trackers: another count puts September at 81% of the pre-war level. No data set can tell you how the war will end, where prices will be in the coming weeks, or what shipping routes will look like, so this article does not try.
This article is for information only and is not investment advice. Sources: EIA, IEA, BLS, AAA, Al-Monitor, Ahram Online, The National, Trading Economics (October 2026).
Continue on DAI
Explore Topics
Written by
Data Analytic Investments
Content creator and writer sharing insights and stories.