Euro area industrial production, September 2026: up 0.2% on the month, down 1.5% on the year, with Hungary near the top at +8.2%
Up 0.2% after a 0.5% fall in August, down 1.5% year on year, Ireland at -19.1% and Hungary at +8.2%. What Eurostat's industrial production index measures, what the groupings show, and what the data does not tell you.

Eurostat reported on 16 November 2026 that seasonally adjusted industrial production rose 0.2% in the euro area and 0.5% in the EU in September compared with August (Eurostat). Compared with September 2025, output was 1.5% lower in the euro area and 0.8% lower in the EU. In August, euro area production had fallen 0.5% on the month.
Among member states, Hungary recorded the second-highest annual increase, +8.2%. Ireland recorded the largest fall.
| Data sheet | |
|---|---|
| Publisher | Eurostat, euro indicators |
| Released | 16 November 2026 |
| Reference period | September 2026 |
| Monthly change, euro area | +0.2% (August: -0.5%) |
| Monthly change, EU | +0.5% (August: -0.3%) |
| Annual change, euro area | -1.5% (August: -1.1%) |
| Annual change, EU | -0.8% (August: -0.1%, revised from -0.2%) |
| Highest annual increases | Netherlands +8.8%, Hungary +8.2% |
| Largest annual decrease | Ireland -19.1% |
What the index measures
The index tracks the volume of output in mining and quarrying, manufacturing, and electricity, gas and steam supply. It measures quantity, not money: how much more or less was produced relative to a base year. Construction is not included and is published separately. Month-on-month changes are seasonally adjusted to remove the usual effect of holidays and summer shutdowns. Year-on-year changes are calendar adjusted.
Short definitions of terms such as volume index and seasonal adjustment are in the glossary.
Groupings: intermediate goods up, energy down
Eurostat splits output into five main industrial groupings (Eurostat):
| Grouping | Euro area, m/m | Euro area, y/y | EU, m/m | EU, y/y |
|---|---|---|---|---|
| Intermediate goods | +0.7% | +0.4% | +0.8% | +1.1% |
| Energy | -1.7% | +0.7% | -1.1% | +0.8% |
| Capital goods | 0.0% | +0.3% | 0.0% | +1.0% |
| Durable consumer goods | +1.3% | +1.6% | +1.2% | +1.5% |
| Non-durable consumer goods | -0.4% | -7.5% | +0.3% | -6.1% |
Most of the annual decline comes from one grouping. Output of non-durable consumer goods, which includes items such as food and pharmaceuticals, was 7.5% below its level a year earlier. The other four groupings were slightly higher than a year ago.
ING's economists wrote that pharmaceuticals underperformed after a very strong second quarter, energy-intensive sectors stayed weak and motor vehicle output rose (ING via FXStreet, 16 November 2026). That is a bank's reading of the data, not part of the Eurostat release.
Countries: Ireland and Hungary at opposite ends
Member state figures (Eurostat, GMK Center, 16 November 2026):
| Monthly | Annual | |
|---|---|---|
| Largest increases | Denmark +3.7%, Poland +2.9%, Czechia and Slovakia +2.7% | Netherlands +8.8%, Hungary +8.2%, Lithuania and Malta +7.1% |
| Largest decreases | Ireland -5.5%, Luxembourg -3.8%, Romania -2.6% | Ireland -19.1%, Bulgaria -8.9%, Romania -6.3% |
Irish industrial data often swing sharply from month to month because the output of a few large multinational pharmaceutical and technology firms is booked there. Ireland's role in the euro area total also came up in the third-quarter GDP flash estimate, covered in this earlier article.
Eurostat compiles its figures from data sent by national statistical offices. Hungary's statistics office (KSH) publishes its own release, which can show a different number because of different adjustment, so the two sources are best read separately.
How it fits with other November releases
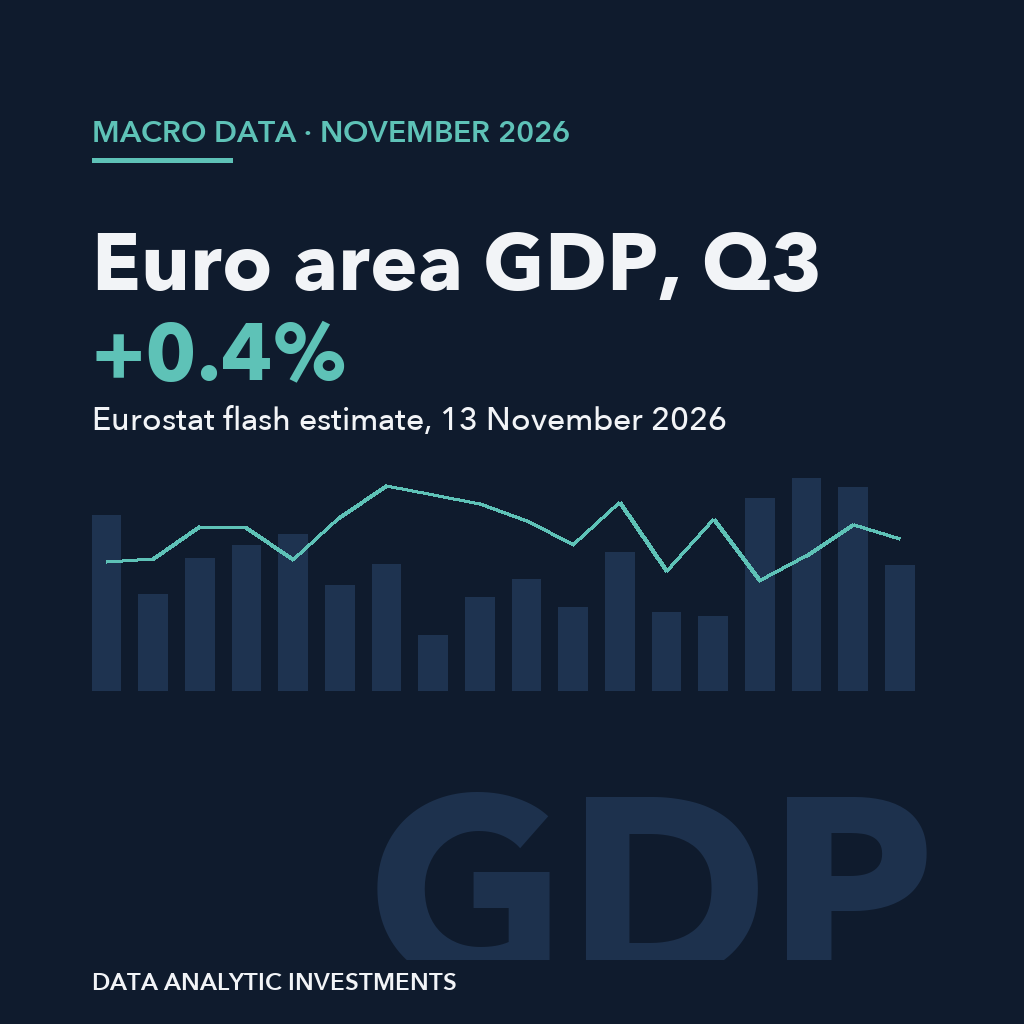
The flash estimate published on 13 November put euro area GDP growth in the third quarter at 0.4%, with employment unchanged (Eurostat, 13 November 2026). September trade data came out the same day and are covered here. Industry is only one part of GDP, and services carry more weight, so the two series can move in different directions.
Macro releases are collected on the macro page, and sourced market prices are on the Market Observation page.
What the data does not show
- It is preliminary. Member states revise their figures. The EU's August annual rate was revised this time, from -0.2% to -0.1%.
- One month is not a direction. ING notes that September's rise followed three monthly declines. A 0.2% gain says nothing about October.
- Volume, not value. The index does not show revenue, profits or prices.
- The average hides a lot. The euro area figure is shaped by a few large economies and by Ireland's swings. A single country's position is in its own row.
- It is not about companies. A sector index says nothing about how any individual firm is doing.
Summary
- In September, industrial production rose 0.2% on the month in the euro area and 0.5% in the EU.
- On the year, output was 1.5% lower in the euro area and 0.8% lower in the EU, driven mainly by non-durable consumer goods.
- Hungary posted the second-highest annual increase at +8.2%. Ireland posted the largest fall at -19.1%.
Related on dataanalyticsystem.com
- Macro overview
- Market Observation: sourced market data
- Euro area GDP, Q3 2026: Eurostat flash estimate
- Euro area trade balance, September 2026
- Data sources
Sources
- Eurostat: Industrial production up by 0.2% in the euro area and by 0.5% in the EU (16 November 2026): https://ec.europa.eu/eurostat/web/products-euro-indicators/w/4-16112026-ap
- Eurostat: GDP up by 0.4% and employment stable in the euro area (13 November 2026): https://ec.europa.eu/eurostat/web/products-euro-indicators/w/2-13112026-ap
- ING Global Economics via FXStreet (16 November 2026): https://www.fxstreet.com/analysis/eurozone-industrial-production-ticked-up-but-still-unimpressive-in-september-202611161128
- GMK Center (16 November 2026): https://gmk.center/en/news/eu-industrial-production-up-0-5-m-m-in-september/
Data Analytic Investments is not affiliated with the institutions and outlets cited; names are used for identification only.
Educational content, not investment advice.
Continue on DAI
Explore Topics
Written by
Data Analytic Investments
Content creator and writer sharing insights and stories.