Consumer confidence, November flash: −16.9 in the euro area, −16.5 in the EU – up a point, but still below its long-term average – what the indicator measures
An indicator that sits below zero and still improved; four questions that build it; twenty-six countries, with one exception. What the consumer confidence indicator measures and how to read it – with sources, without forecasts.
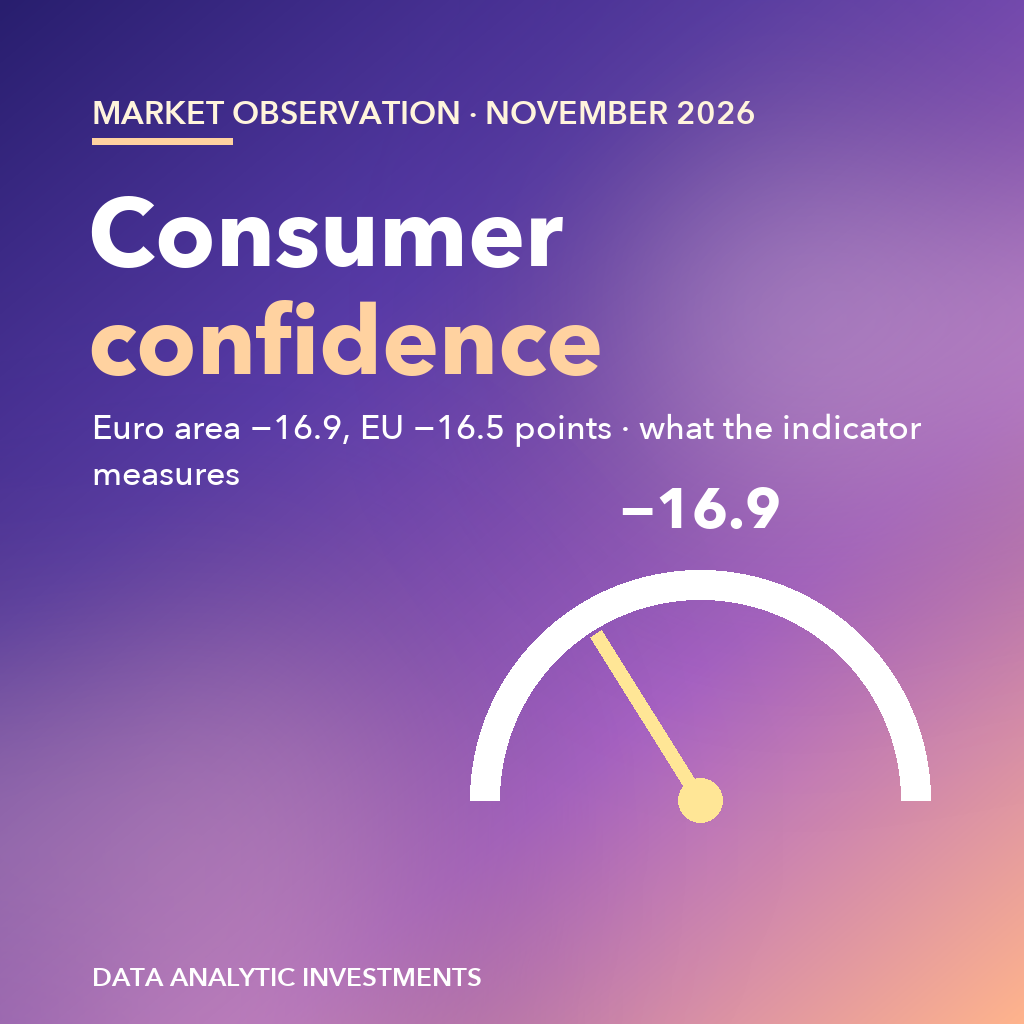
Economic news often features a negative number that is nonetheless said to have "improved". Consumer confidence is one of them. According to the flash estimate of 20 November by the European Commission's Directorate-General for Economic and Financial Affairs (DG ECFIN), the indicator rose in November in both the euro area and the EU. Portfolio's report based on the Hungarian news agency MTI (in Hungarian) covered it the same day. This article explains what the indicator measures and how to read it. It is not an economic forecast.
| Fact sheet | |
|---|---|
| Released by | European Commission, DG ECFIN, 20 November 2026 (flash estimate) |
| Euro area | −16.9 points (+1.0 points on the month) |
| EU | −16.5 points (+0.8 points) |
| October (euro area) | −17.9 points (Portfolio/MTI) |
| Survey period | 1–19 November |
| Coverage | 26 EU countries (all except Estonia) |
| Long-term average | the indicator remains "well below" it |
| Full data | 27 November; next flash: 21 December |
Sources: European Commission, 20 Nov, Portfolio / MTI, 20 Nov.
What happened
According to the Commission's flash estimate, euro-area consumer confidence rose by 1.0 point to −16.9, and EU confidence by 0.8 points to −16.5. The release says the indicator remains well below its long-term average. According to Portfolio/MTI, analysts had expected no change; October's −17.9 was the weakest since May. This article's check: −17.9 + 1.0 = −16.9; worked back from this, the EU's October level was about −17.3.
The year so far, according to the source
| Date | Euro area |
|---|---|
| November 2025 | −12.9 |
| January 2026 | −12.5 |
| April 2026 (low of the year) | −20.5 |
| October 2026 | −17.9 |
| November 2026 | −16.9 |
| Record low: September 2022 | −27.5 |
Source: Portfolio / MTI; November figure: European Commission.
What the indicator measures
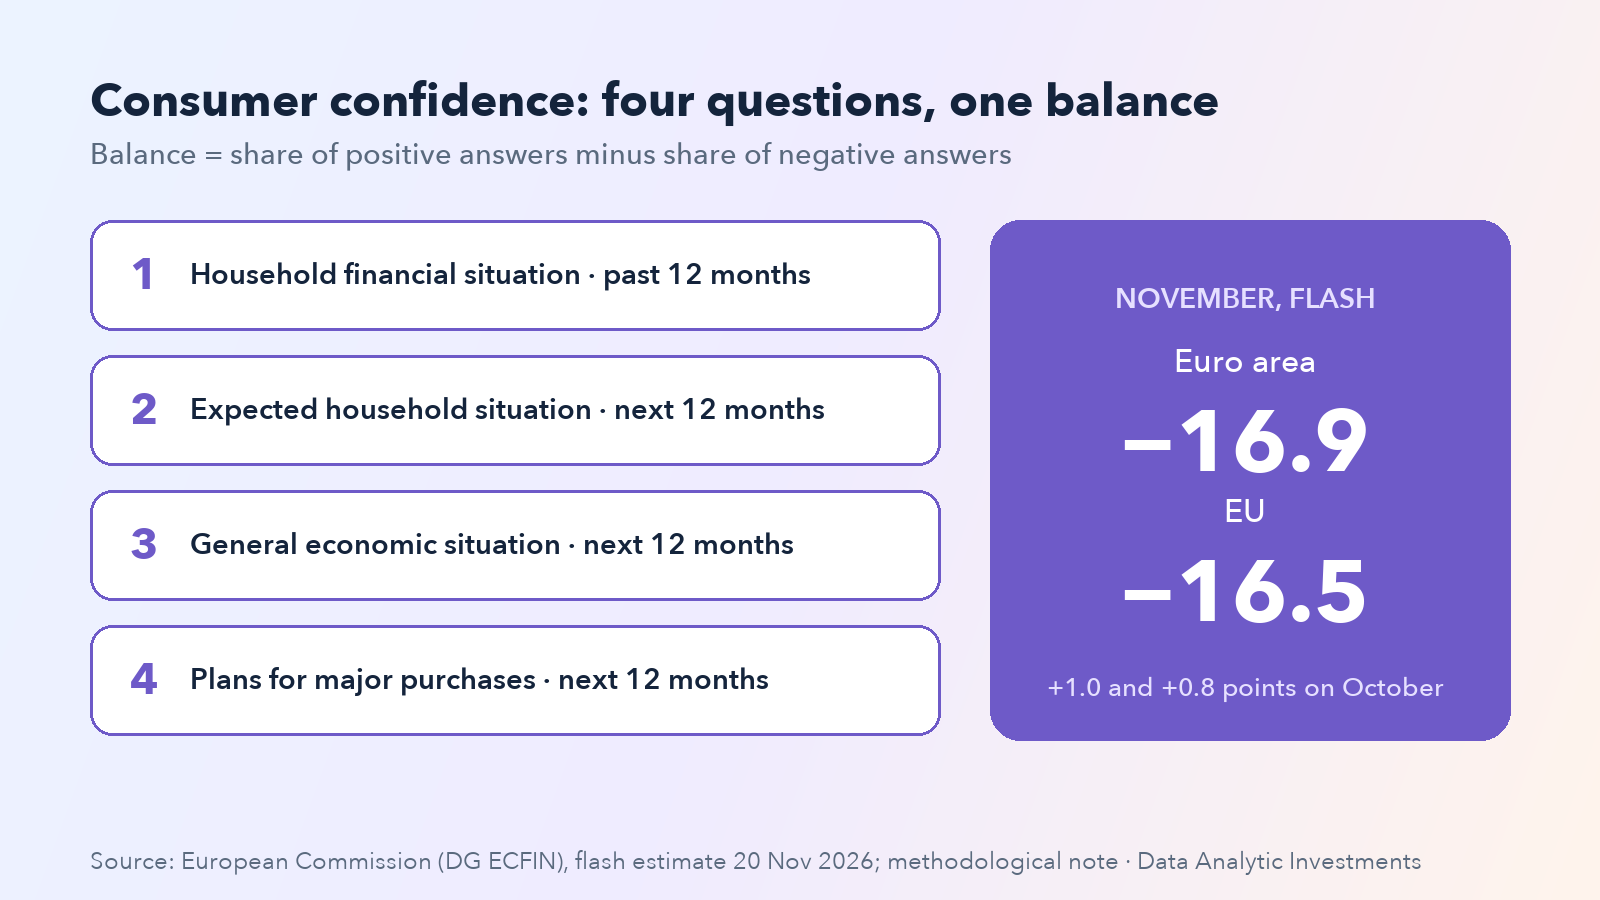
The consumer confidence indicator is part of the Commission's Joint Harmonised EU Programme of Business and Consumer Surveys. According to the Commission's methodology note, since January 2019 it has been the equally weighted average of four questions:
| Question | Time frame |
|---|---|
| The household's financial situation | past 12 months |
| The household's expected financial situation | next 12 months |
| The expected general economic situation in the country | next 12 months |
| Plans for major purchases compared with the past year | next 12 months |
For each question a balance is calculated: the share of negative replies is subtracted from the share of positive ones. If 20% of respondents report an improvement and 40% a deterioration, the balance is −20. That is why the index can stay negative for long periods: it shows that pessimistic replies outnumber optimistic ones, not that spending is falling.
What a flash estimate is
A flash estimate is built from replies received by the survey cut-off; the full results by country are published on 27 November. According to the source, the 26 countries cover 99.8% of total EU private consumption. Hungary is among the surveyed countries; its own figure comes with the full release.
What to look at in news like this
- Level and direction are separate questions. −16.9 is an improvement on the month, but a pessimistic level.
- Flash or full data? A flash estimate can be slightly revised later.
- Opinion, not spending. Actual consumption is measured by retail and national-accounts data.
- Expectations vs facts. The analysts' expectation is only a point of comparison, not part of the indicator.
5 things many people don't know
- The index is a balance, not a percentage. Positive minus negative replies.
- It is built from four questions. Two on household finances (past and future), one on the country and one on major purchases — according to the methodology.
- Estonia was left out of the November flash. The other 26 countries are included.
- "Improved" can be true below zero. From −17.9 to −16.9.
- The full data come a week later. On 27 November.
Summary
- Euro area: −16.9 points, +1.0.
- EU: −16.5 points, +0.8.
- Level: well below the long-term average.
- Method: the average of four survey balances.
- Next: full data on 27 November, flash on 21 December.
Related reading: Blog archive.
Educational content. Not investment advice and not an economic forecast. This article describes a public European Commission release and a press source. Data Analytic Investments is not affiliated with the European Commission or the portal cited.
Continue on DAI
Explore Topics
Written by
Data Analytic Investments
Content creator and writer sharing insights and stories.