Euro area trade, September 2026: a €10.3 billion goods deficit in Eurostat's first estimate
Imports rose 16.1% year on year, exports 6.0%. The EU as a whole ran a €16.8 billion deficit. According to the release, the swing came mainly from a wider energy deficit and a smaller surplus in machinery and vehicles.
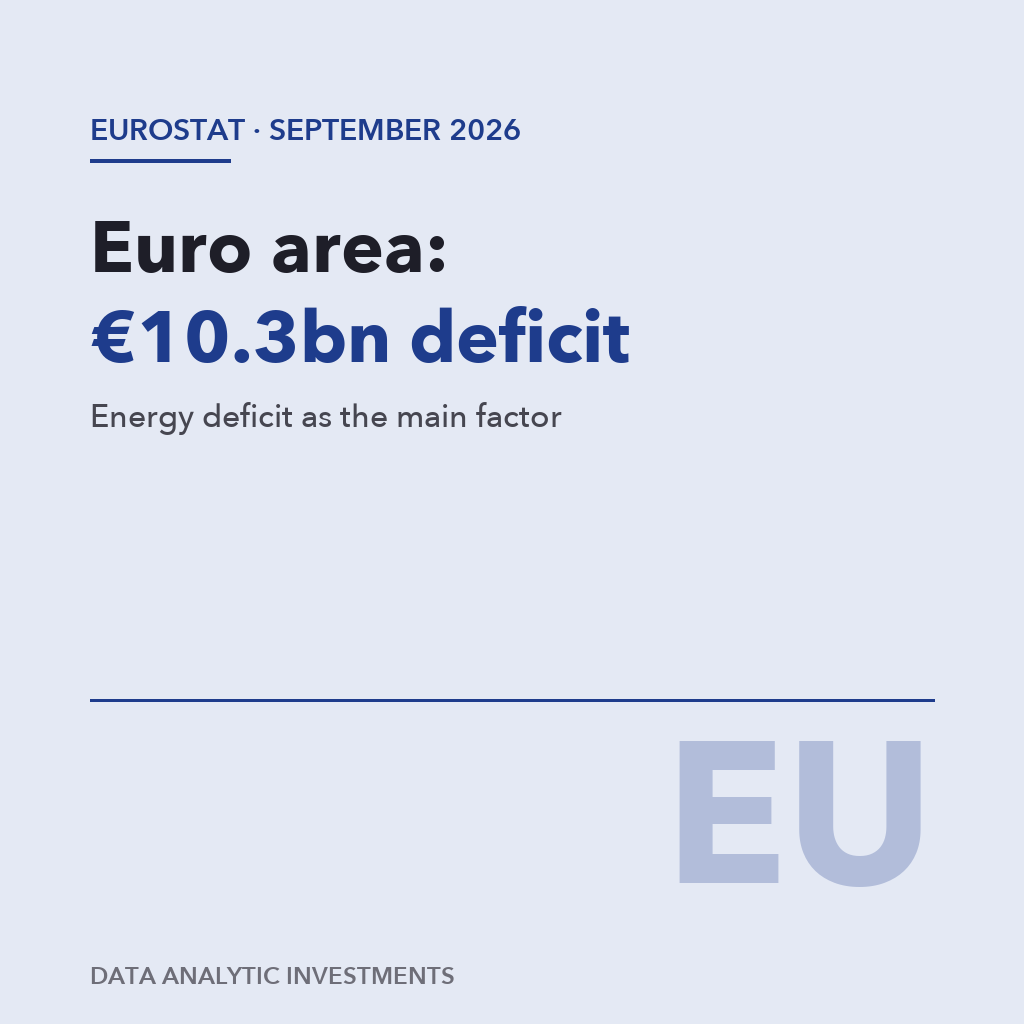
On 13 November 2026 Eurostat published its first estimate of euro area and EU trade in goods for September. The euro area recorded a €10.3 billion deficit in trade in goods with the rest of the world in September 2026. A year earlier, in September 2025, it had a €13.5 billion surplus (Eurostat, euro indicators, 13 November 2026). The 27 EU Member States together recorded a €16.8 billion deficit, compared with an €11.4 billion surplus a year earlier.
This article goes through what the release contains, how to read the table, and what the data cannot tell you. The figures are provisional: they are based on data Member States sent to Eurostat before 10 November.
| Data sheet (not seasonally adjusted, € billion) | Sep 2025 | Sep 2026 | Change | Jan–Sep 2025 | Jan–Sep 2026 | Change |
|---|---|---|---|---|---|---|
| Euro area, exports | 257.2 | 272.7 | +6.0% | 2,209.3 | 2,263.4 | +2.4% |
| Euro area, imports | 243.7 | 283.0 | +16.1% | 2,107.1 | 2,299.9 | +9.2% |
| Euro area, balance | +13.5 | −10.3 | +102.2 | −36.5 | ||
| EU27, exports | 229.4 | 240.1 | +4.7% | 1,991.2 | 2,008.9 | +0.9% |
| EU27, imports | 218.0 | 256.9 | +17.9% | 1,905.7 | 2,092.1 | +9.8% |
| EU27, balance | +11.4 | −16.8 | +85.5 | −83.2 |
Source of the table: Eurostat, 13 November 2026. EU figures cover trade with non-EU countries; euro area figures cover trade with countries outside the euro area.
What does this number measure?
The trade balance here is the difference between exports and imports of goods. Services such as tourism, financial or digital services are not included. The euro area figure covers trade between the euro area and the rest of the world, not trade between member countries. When imports grow faster than exports, a surplus shrinks or turns into a deficit. That is what happened in September: euro area exports rose 6.0% year on year, while imports rose 16.1%.
The nine-month total has also reversed. In January to September 2025 the euro area had a €102.2 billion surplus. In the same period of 2026 it had a €36.5 billion deficit.
Seasonally adjusted figures
Monthly figures are affected by the number of working days and by seasonal patterns. Eurostat therefore also publishes a seasonally adjusted series (release):
- Euro area: in September exports rose 2.0% (to €262.2 billion) and imports rose 2.3% (to €270.9 billion) compared with August. The balance was −€8.7 billion, after −€7.8 billion in August.
- EU: exports rose 1.2% and imports 1.7%. The balance was −€14.6 billion, after −€13.2 billion in August.
- July to September: the adjusted euro area balance for the three months was −€17.9 billion in total, and the EU balance −€36.0 billion.
The adjusted and unadjusted figures differ (−€8.7 billion and −€10.3 billion for September). This comes from the method, not from a contradiction.
The previous monthly release had already shown a €16.1 billion euro area deficit for August (Eurostat, 16 October 2026).
Product groups: energy and machinery
According to the release, the main factor behind the year-on-year decline was a wider energy deficit. In the euro area the energy deficit grew from €20.7 billion to €33.0 billion, and in the EU from €24.1 billion to €37.6 billion. At the same time the surplus in machinery and vehicles narrowed: in the euro area from €10.0 billion to €3.0 billion, and in the EU from €13.1 billion to €3.3 billion (release).
EU breakdown by product group, September 2026 (€ billion, year-on-year change in brackets):
| Product group (EU) | Exports | Imports | Balance Sep 2026 | Balance Sep 2025 |
|---|---|---|---|---|
| Food and drink | 19.3 (+5.5%) | 14.4 (+0.6%) | +4.9 | +4.0 |
| Raw materials | 6.4 (+14.9%) | 9.5 (+19.2%) | −3.1 | −2.3 |
| Energy | 13.9 (+39.5%) | 51.5 (+51.3%) | −37.6 | −24.1 |
| Chemicals | 48.5 (−13.5%) | 29.5 (−1.7%) | +19.0 | +26.0 |
| Machinery and vehicles | 95.6 (+8.0%) | 92.3 (+22.5%) | +3.3 | +13.1 |
| Other manufactured goods | 49.4 (+6.8%) | 55.8 (+5.4%) | −6.4 | −6.7 |
The surplus in chemicals, a group that includes pharmaceuticals, also fell, from €26.0 billion to €19.0 billion, as exports dropped 13.5%.
Main partners (EU)
The release gives partner data for the EU as a whole, for September (release):
| Partner | Exports | Imports | Balance Sep 2026 | Balance Sep 2025 |
|---|---|---|---|---|
| United States | 47.7 (−10.6%) | 36.8 (+14.7%) | +10.9 | +21.3 |
| China | 16.5 (−1.4%) | 58.2 (+12.2%) | −41.7 | −35.2 |
| United Kingdom | 33.5 (+13.9%) | 14.8 (+10.8%) | +18.7 | +16.1 |
| Switzerland | 21.5 (+14.9%) | 12.5 (+4.9%) | +9.0 | +6.8 |
| Norway | 6.3 (+8.4%) | 12.6 (+60.1%) | −6.3 | −2.1 |
| Türkiye | 9.7 (+7.1%) | 8.5 (−0.1%) | +1.2 | +0.5 |
Two things stand out. EU exports to the United States were 10.6% lower than a year earlier, so the surplus with the US roughly halved. The deficit with China widened to €41.7 billion. Imports from Norway rose 60.1%; the release does not break down at partner level which products are behind this.
What the data shows and what it does not
What it shows:
- Euro area and EU trade in goods ended September 2026 in deficit, after a surplus a year earlier.
- According to the release, the main factors were a wider energy deficit and a smaller surplus in machinery and vehicles.
- The seasonally adjusted deficit widened slightly from August to September.
What it does not show:
- Final figures. These are first estimates and may be revised.
- Causes. The release describes product groups and partners. It does not say how much is a price effect (more expensive energy) and how much a volume effect.
- The full current account. Services, income and transfers are not included; those are in the ECB's balance of payments statistics.
- A country-by-country view. The page used here has no Member State table; that is available in the Eurostat database.
- A forecast. One month of data says nothing about the direction of the next. The next release is due on 16 December 2026.
Where to look further
The full series is in the Eurostat database: table ext_st_ea_sitc for the euro area and ext_st_eu27_2020sitc for the EU (Eurostat database).
Sources
- Eurostat, Euro indicators: Euro area international trade in goods deficit €10.3 bn, 13 November 2026
- Eurostat, Euro indicators: Euro area international trade in goods deficit €16.1 bn, 16 October 2026
- Eurostat, Euro indicators release list
- Eurostat database, ext_st_ea_sitc
Data Analytic Investments Kft. is not affiliated with Eurostat, the European Commission or any institution mentioned in this article.
Educational content. Not investment advice.
Continue on DAI
Explore Topics
Written by
Data Analytic Investments
Content creator and writer sharing insights and stories.