Single-company analysis: how one is made, from order to PDF
Four frameworks (K1–K4), a source and date next to every figure, a PDF within 24 hours. How a single-company analysis is made, and what it leaves out.

A single-company analysis is a sourced, tabular PDF about a company or topic you choose, delivered by email within 24 hours. This article follows the path from order to finished document. It explains the four frameworks (K1–K4), what an analysis contains, and what you will not find in it.

Prices and delivery
According to the product page:
| Option | Price | What you get |
|---|---|---|
| First analysis for new customers | free, once | enter the code FREE in the promotion code field at payment |
| 1 analysis | $5, one-time | one PDF by email within 24 hours |
| 10-analysis pack | $29 | ten single-use codes by email, one code per analysis |
Payment runs through Stripe and accepts cards, Apple Pay, Google Pay, Revolut Pay and other local methods.
The four frameworks: K1–K4
When you order, you choose one framework. It sets the question the document answers.
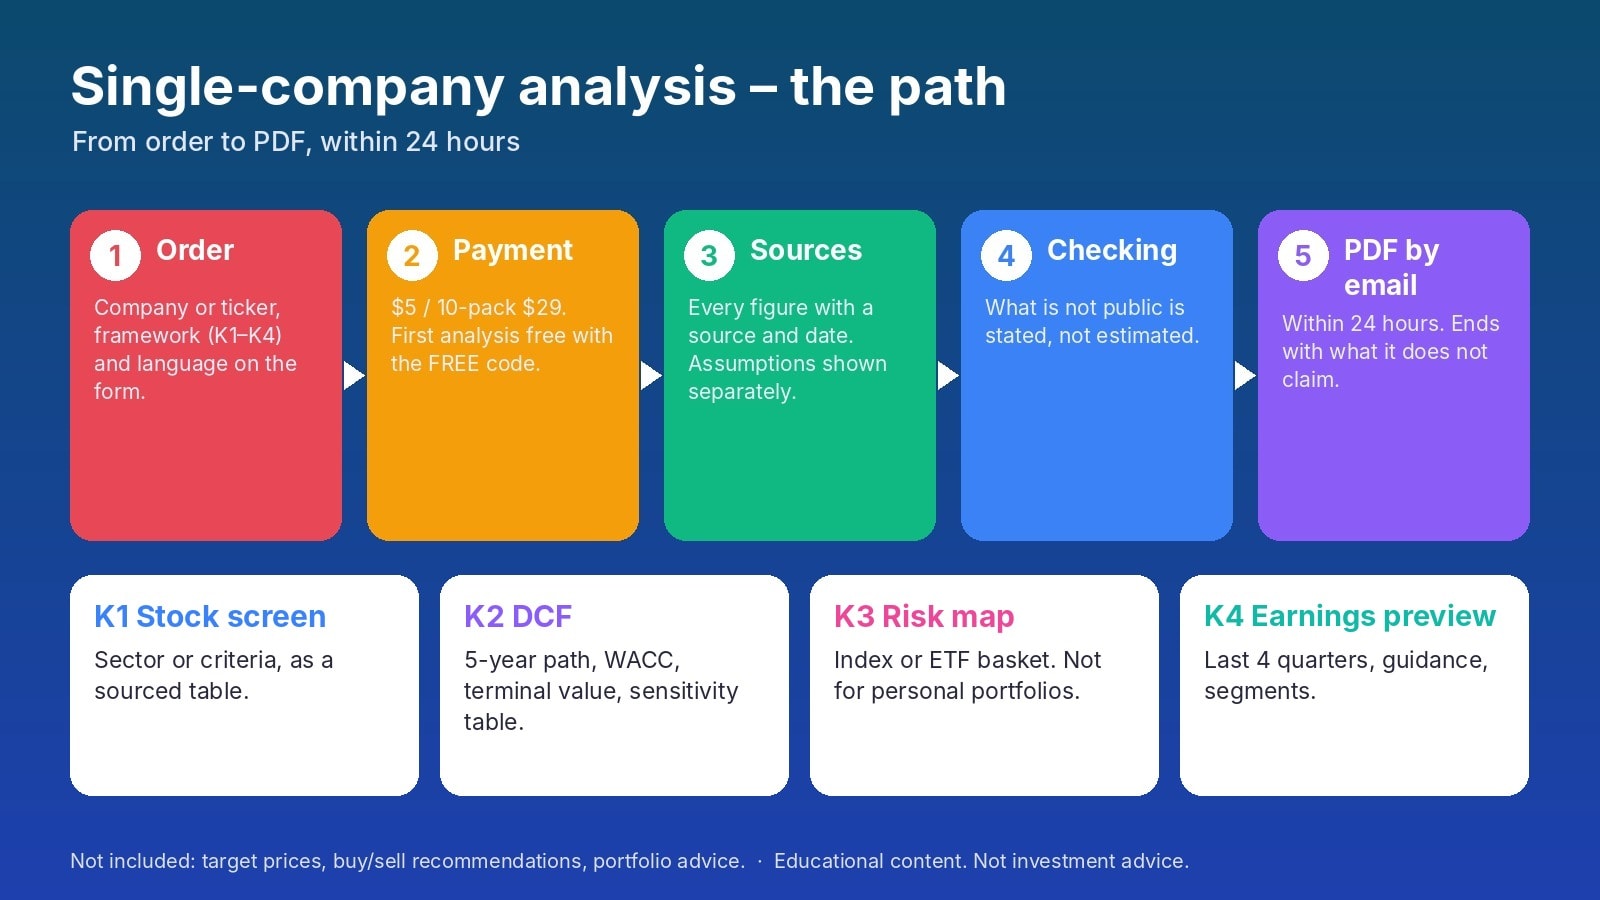
K1, Stock screen. It is based on a sector or a set of criteria. Typical criteria are P/E against the sector average, five-year revenue growth, debt-to-equity, dividend sustainability and a description of competitive advantage. The result is a sourced table.
K2, DCF walk-through. It covers one company. It includes a five-year path for revenue and margins, free cash flow, a WACC (weighted average cost of capital) derivation, terminal value by two methods, and a sensitivity table. The sensitivity table shows how much the result moves when one assumption changes.
K3, Risk map. It covers one public index or ETF basket. It includes correlation, sector and currency exposure, interest-rate sensitivity, historical drawdowns and liquidity. This framework is not offered for personal portfolios.
K4, Earnings preview. It covers one company and one date. It includes the last four quarters of actual results against expectations, the metrics to watch, segments, quoted management guidance, and price moves after earlier reports.
How is it made? Three steps
- Order. On the form, enter the company name or ticker, the framework and the language.
- Pay. Use any of the methods above. For your first analysis, the FREE code is enough.
- Delivery. The PDF arrives by email within 24 hours.
What is in an analysis?
The product page describes four rules that apply to every document:
- Every figure carries its source and date. You can trace any number back.
- Assumptions are shown separately. Estimates are not mixed in with reported figures.
- What is not public is not invented. When data is not publicly available, such as analyst consensus or options-implied moves, the analysis says so instead of estimating it.
- It ends with what it does not claim. Each document closes with a short section on what it is not suited for.
What does it not contain?
The product page lists it word for word: no target prices, no buy or sell recommendations, no portfolio advice and no promised returns. The analysis describes and organises. It does not make a decision for the reader.
This is not a courtesy formula. Data Analytic Investments Kft. is an educational and market-information provider, not an investment firm. The document is there so readers can see the numbers, their sources and the assumptions, and draw their own conclusions.
5 things many people don't know
- The first analysis is free. New customers get it once, with the FREE code.
- The 10-pack comes as codes. You receive ten single-use codes by email, each worth one analysis, so the codes can also be shared.
- K3 is not for your own portfolio. The risk map covers a public index or ETF basket, not personal holdings.
- "No data" is a result too. If something is not public, the analysis says so rather than filling the gap with an estimate.
- The sensitivity table is the heart of a DCF. It shows how much the result depends on one or two assumptions, which often tells you more than a single final number.
Who is it for?
It is for readers who want a company's numbers in an organised, sourced format, and who are curious how a DCF, a screen or an earnings preview is built. It also suits anyone learning these methods, because the steps are easier to follow on a real company than on a textbook example.
Frequently asked questions
Can I choose any company? The product page refers to a company or ticker with publicly available data. If a data point is not public, the analysis says so and does not estimate it.
What language is it written in? You choose the language on the order form. The website itself is available in English and Hungarian.
Are there sample analyses? According to the product page, samples are coming soon.
Sources and links
- The analysis page: dataanalyticsystem.com/en/analysis
- In Hungarian: dataanalyticsystem.com/elemzes
- Withdrawal policy: /elallas · Regulatory disclosure: /regulatory
This content does not qualify as a regulated financial service under the MiCA regulation or Hungarian law.
Educational content. Not investment advice.
Continue on DAI
Explore Topics
Written by
Data Analytic Investments
Content creator and writer sharing insights and stories.